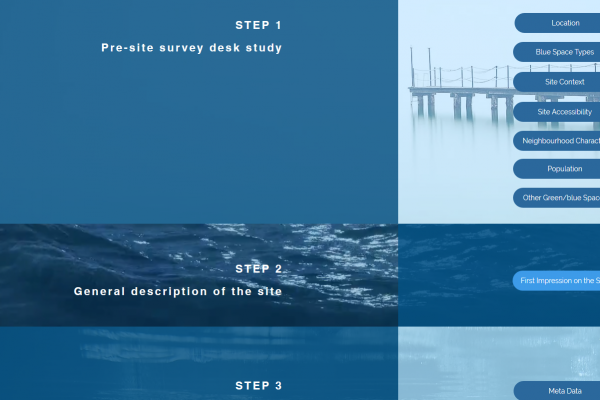


The BlueHealth Behavioural Assessment Tool (BBAT) has been designed to capture the activities that people take part in, at a particular blue space.
The tool employs non-participatory direct observation (i.e. behavioural mapping). We have transformed the usual paper-based momentary time sampling method of mapping into a geographical information system (GIS) software-based approach, using portable devices. This makes for a much more efficient process and considerably increases the potential for subsequent analysis of the data collected.
The exact location, type of activity and basic demographic characteristics of the users of the area are all recorded during systematic on-site observations. Weather and time variables are also recorded (including day/week/season).
The collected data can reveal the more popular and the less -frequented locations within an overall space and helps to identify differences in the spatial distribution of activities moderated by social, weather and time variables. Repeated observations before and after changes are made to a site, as was done at the Teat’s Hill intervention, enable monitoring of changes in usage patterns in a given space, allow us to assess design success and, potentially, to estimate the return on investment.
To use the BBAT you will need the QGIS software. This Open Source software is free to use. The tool itself was developed using QGIS version 2.8.17. It should run without problems in the latest stable version.
Before starting, please download the BBAT resource pack. This includes a sample map, sample data and a PDF protocol download, which describes the BBAT behaviour mapping method.
The video below demonstrates step-by-step how to set up the BBAT for your site, including a crash-course in GIS for beginners. So, even if you are completely new to this field, you will be up and running in just a few hours.
For more information about this tool please contact Peeter Vassiljev.
When using the Tool please include the following reference: Bell, Simon; Mishra, Himansu Sekhar; Elliott, Lewis R.; Shellock, Rebecca; Vassiljev, Peeter; Porter, Miriam; Sydenham, Zoe; White, Mathew P. (2020). Urban Blue Acupuncture: A Protocol for Evaluating a Complex Landscape Design Intervention to Improve Health and Wellbeing in a Coastal Community. Sustainability, 12 (10), 4084.10.3390/su12104084.
The tool adopts different monitoring methods according to a site’s size and layout.
For larger locations, several monitoring points are used. Observers walk systematically over the entire area, stopping at predetermined locations to scan the visual field from left to right in a full circle. For smaller sites, observers can be stationed at a single location, provided they have clear visibility of the entire area. In such smaller spaces, repeat observations can be made by dividing the site into smaller segments and then observing each segment cyclically for 5 minutes each over a two-hour period.
The location of every user within the scanning area is marked on the map, which is loaded into the GIS and displayed on the portable device. Subsequently, for each point marked, a series of drop-down menu selections can be made in the GIS interface to capture gender, approximate age group, social interaction, primary activities and (optionally) secondary activities.
The time of day, day of the week, and general weather parameters are recorded at the beginning of each observation session. To cover a wider range of weather and temporal conditions, the data are collected once during the observation day, according to a predetermined scheduling scheme of four-time periods within a day. This includes alternating between two workdays and one weekend day within a week.
Using the data
The data collected can be combined with a digital interface on a tablet computer. Planned analyses include descriptive and predictive statistical analysis, for example, accounting for visitor characteristics of the observation data obtained from the tool.
For BlueHealth in particular, we have been interested in whether different types of users interact with different aspects of the site in different ways following the intervention. This has involved a particular focus on whether the change in environmental affordances is seen to influence the behaviours exhibited in predictable ways.
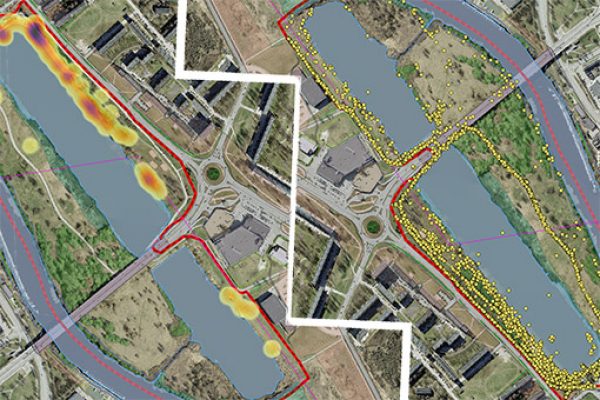
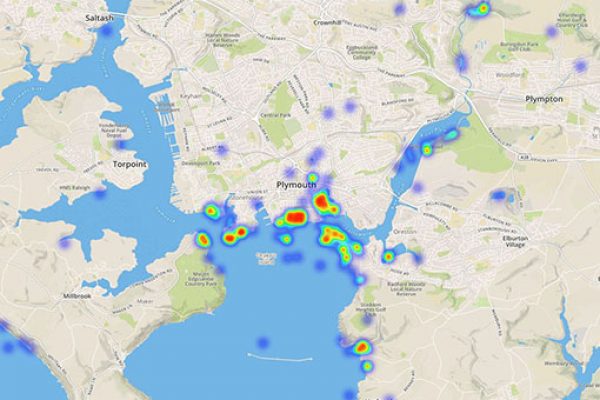
While descriptive analyses may reveal activity and user profiles within the study area, additional visual analysis of the data (e.g. heat maps) reveal activity concentration related to specific behaviour settings.
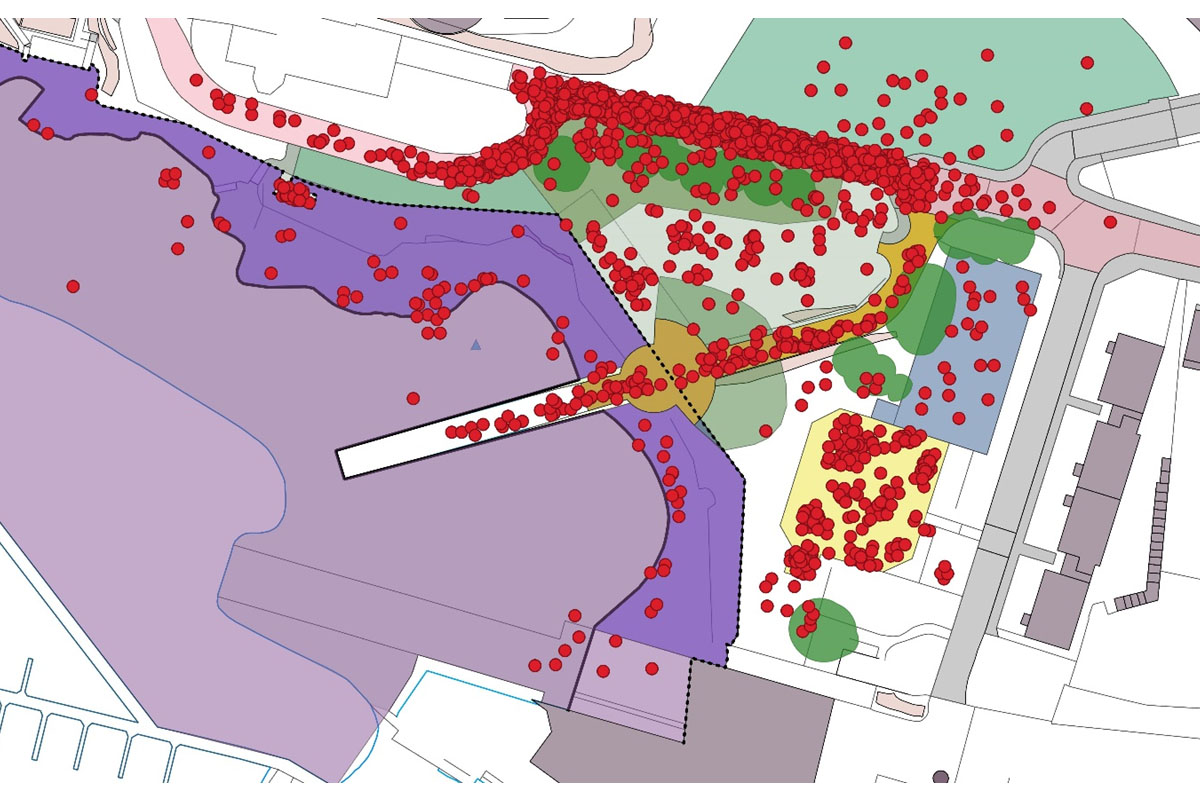
A point cloud shows the number of activities observed at different locations within a site for a particular observation period.
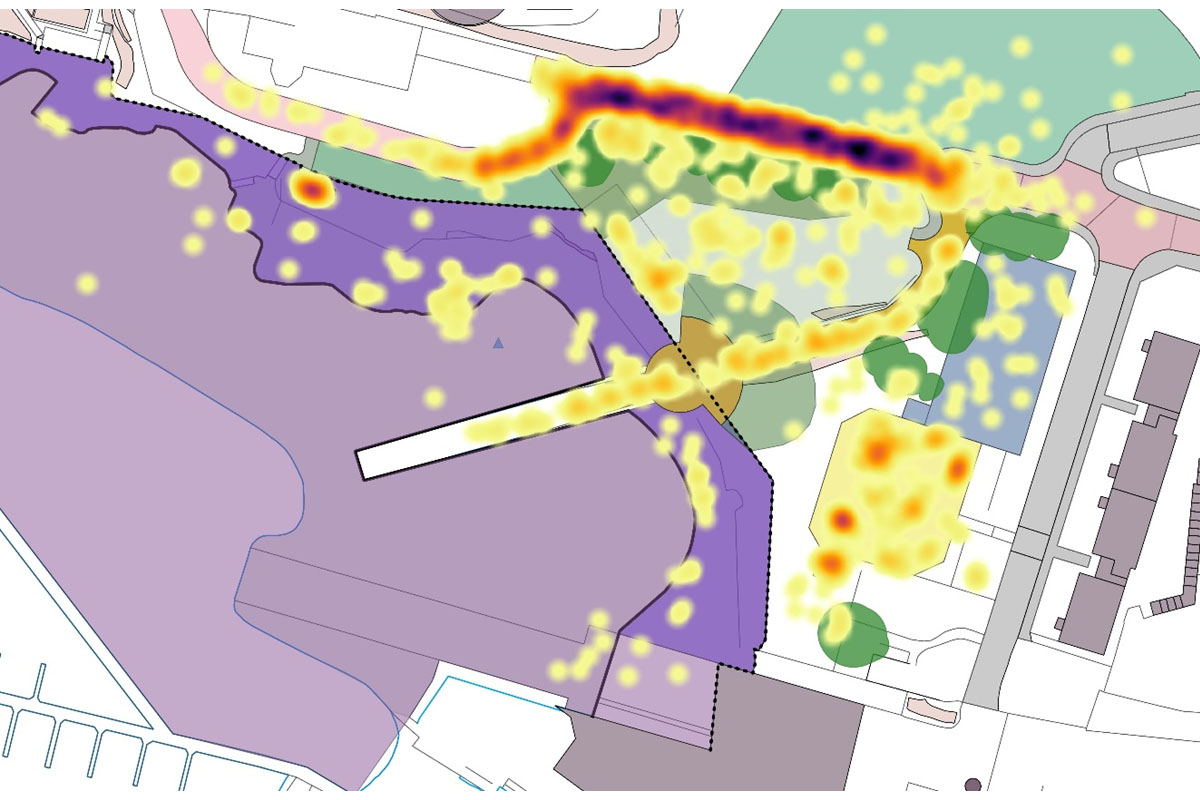
A heat-map shows use intensity and distribution at the site, marked by a gradient from yellow for the lower density and to purple for the highest density.