This multi-country investigation focused on the recreational use of blue spaces and their relationship with human health.
An international online survey was conducted between June 2017 and April 2018, with data collected from 18,838 respondents across 18 countries.
Analyses from this project are currently being completed and you can view the first of these in the journal Landscape and Urban Planning.
Below we provide an outline of how the survey was constructed, with much more detail available in the technical report.
Countries included
Much prior blue space research has focused on links between coastal visits and health.
To ensure relevance to this work, included countries had coastlines which bordered one of Europe’s principal seas, with the Czech Republic providing a landlocked comparator. Data were thus gathered in four seasonal stages across the following 14 European countries:
Bulgaria, the Czech Republic, Estonia, Finland, France, Germany, Greece, Ireland, Italy, Netherlands, Portugal, Spain, Sweden, and the United Kingdom.
Data were also collected from four other territories: Hong Kong, Canada, Australia (primarily Queensland), and the USA ( California only).
The survey was delivered online by YouGov, a UK-based market research company, through their registered panels of participants. Where YouGov did not have an internal panel of participants in a country, data collection was outsourced to a similar company. The presentation and content of the survey was identical across countries, with the exception of Ireland, where several demographic questions were asked (automatically logged in all other cases).
Representative samples were sought from each country, with participant quotas set to match regional compositions of sex (male, female) and age group (18-29, 30-39, 40-49, 50-59, 60+ in Europe).
Previous work has shown that blue space visits are strongly related to season (and weather) and data was collected in four, approximately-monthly waves of data collection.
Survey questions
The first part of the survey evaluated subjective wellbeing.
Participants were asked to report their satisfaction with life as a whole before answering a seven-item personal wellbeing index, probing satisfaction with standard of living, health, achievements in life, personal relationships, safety, community connectedness, and future security.
Eudaimonic wellbeing (how worthwhile perceived daily activities were), as well as positive (happiness) and negative (anxiety) experiential wellbeing were also measured.
The second survey module asked how often participants had made recreational visits to different green and blue spaces in the last four weeks. On successive pages, participants were presented with lists and visual examples of blue environments and asked how often they had visited each space. The types of environment included:
- Urban green spaces such as local parks, large urban parks, community gardens or allotments, playgrounds or playing fields, cemeteries or churchyards, botanical gardens or zoos;
- Rural green spaces such as woodlands or forests, farmland or arable land, meadow or grassland, mountains, moorland or heathland, country parks);
- Urban inland blue spaces like fountains, urban rivers or canals, swimming pools or outdoor spas;
- Rural inland blue spaces including ponds/streams/small water bodies, lakes, rural rivers or canals, waterfalls, wetlands, outdoor ice rinks;
- Urban coastal blue spaces such as esplanades/promenades, piers, harbours or marinas; and
- Rural coastal blue spaces including sandy beaches, rocky shores, cliffs and headlands, lagoons, open sea.
The third module concerned perceptions of natural environments. Participants were asked about their motivations for visiting green and blue spaces, whether they had a view of blue space from their home, the quantity of nearby blue space, and whether they commuted through these environments for daily activities. The perceived quality and safety of these spaces was collected.
Overall connectedness to nature was also measured, along with participants’ childhood contact with blue spaces.
The fourth set of questions was presented only to those who indicated they had visited a blue space at least once in the last four weeks. Participants were asked in detail about this visit, providing information about the type of visit, where it was, what kind of activity it involved, and how it made them feel. This section also featured several cost-related questions.
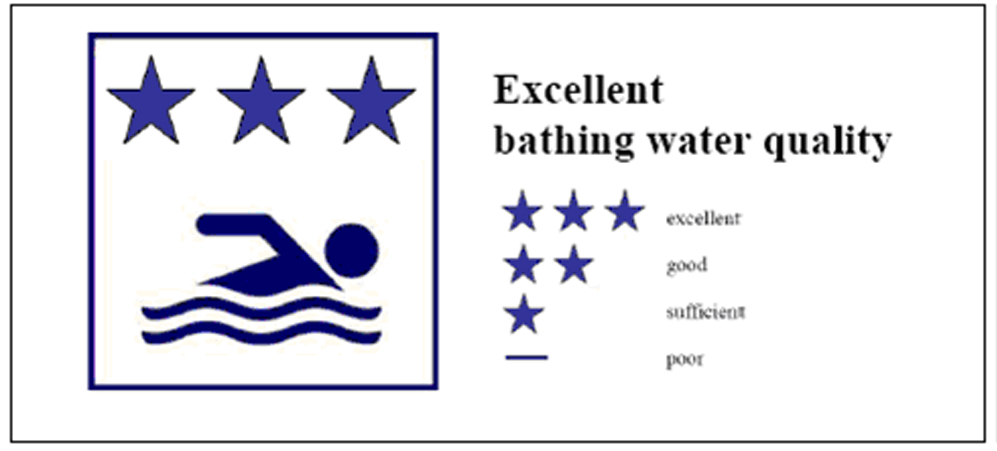
The next survey module tested the effects of bathing water signage on participant behaviour. This section was designed to understand the effects that new signs might have had on the frequency of visits made to blue spaces previously described.
The sixth set of survey questions focused on the health of participants. In addition to several questions on physical health and mental wellbeing, information on alcohol consumption, smoking status, and medicine prescriptions were also gathered here.
Before completing the survey, respondents answered general questions related to their lives. Swimming ability, dog and car ownership, garden access, social contact, employment status, educational attainment, and ethnic minority status were included in this set of items.
Additional general demographic information, such as sex and age, was collected by YouGov.
Non-European countries were asked an additional set of questions which varied by country, please refer to the technical report for full details.
Additional data
To help investigate a broad set of relationships between blue spaces and health, we included other sources of data in the BlueHealth survey.
These were predominantly linked to participants’ home locations, which were processed confidentially and anonymously.
The main data we added to our sample focused on proximity to different natural environments. We used existing distance-based and coverage-based datasets to calculate people’s ‘exposure’ to various blue spaces:
- Coastal areas
- Lakes and rivers
- Type of land cover
- Surrounding green spaces
We also included data on population density, based on data for the number of people living in each squared kilometre across the world. This data is useful to help classify the types of areas in which our participants live.
The additon of these extra data sources allow us to control for other factors which might influence our analyses, as well as providing a greater insight into the types of environments our participants have access to.
Survey development
Several stakeholders were involved in the development of this research.
Ideas for the survey’s original content were initially reviewed by members of the BlueHealth consortium, before being refined further by the project team in summer 2016.
In parallel with this, we held a half-day consultation with the Health and Environment Public Engagement Group at the University of Exeter. We asked attendees to work through paper copies of the survey, making comments on potential oversights and omissions, as well as any instances of ambiguity, verbose or taxing language, or items which participants would
find difficult to answer.
This consultation resulted in the inclusion of additional options for blue space activities, an item on the accessibility of public transport, and an item on self-consciousness at blue spaces.
Throughout the final quarter of 2016 the survey was finalised, approved by the University of Exeter Medical School Research Ethics Committee (Ref: Aug16/B/099), and submitted to YouGov for final formatting.
The finished survey was piloted in early 2017, before being translated and completed in four seasonal waves between June 2017 and April 2018.
Beyond BlueHealth
BlueHealth participated in the Horizon 2020 Open Data pilot, which encourages EU funded research projects to make data free to use, reuse, and redistribute.
An 11-country subset of the data is now available for download from the UK Data Service.


